Introduction
Aims
In this part of the activity we will:
- Measure sound (an input) using the microbit
- Make a real time graph of the sound level on the computer
- Visualise the sound level on the micro:bit
Learning outcomes
| Learning outcome | |
|---|---|
| Inputs | Measuring inputs with a microcontroller |
| Graphing serial data | Graph serial data on a pc |
| Visualise data | Visualise data on the micro:bit |
Preperation
Equipment required
| Equipment item | Quantity |
|---|---|
| Laptop/PC | 1 |
| Micro:bit | 1 |
| USB cable | 1 |
Activity
Measure sound using the microbit
Write the program below
This program uses serial communication to send the sound value the micro:bit measures back to the computer so that we can look at the value it on the computer screen. (We can imagine this like the microbit having a conversation with the computer)
| Blocks | Python |
|---|---|

|

|
Now check the program works!
There are some instructions in the image below
- Try it out in the simulator first
- Then try it out for real on your micro:bit
- Note you need to be connected to the micro:bit for this to work (both with a usb cable, and in the makeCode environment)
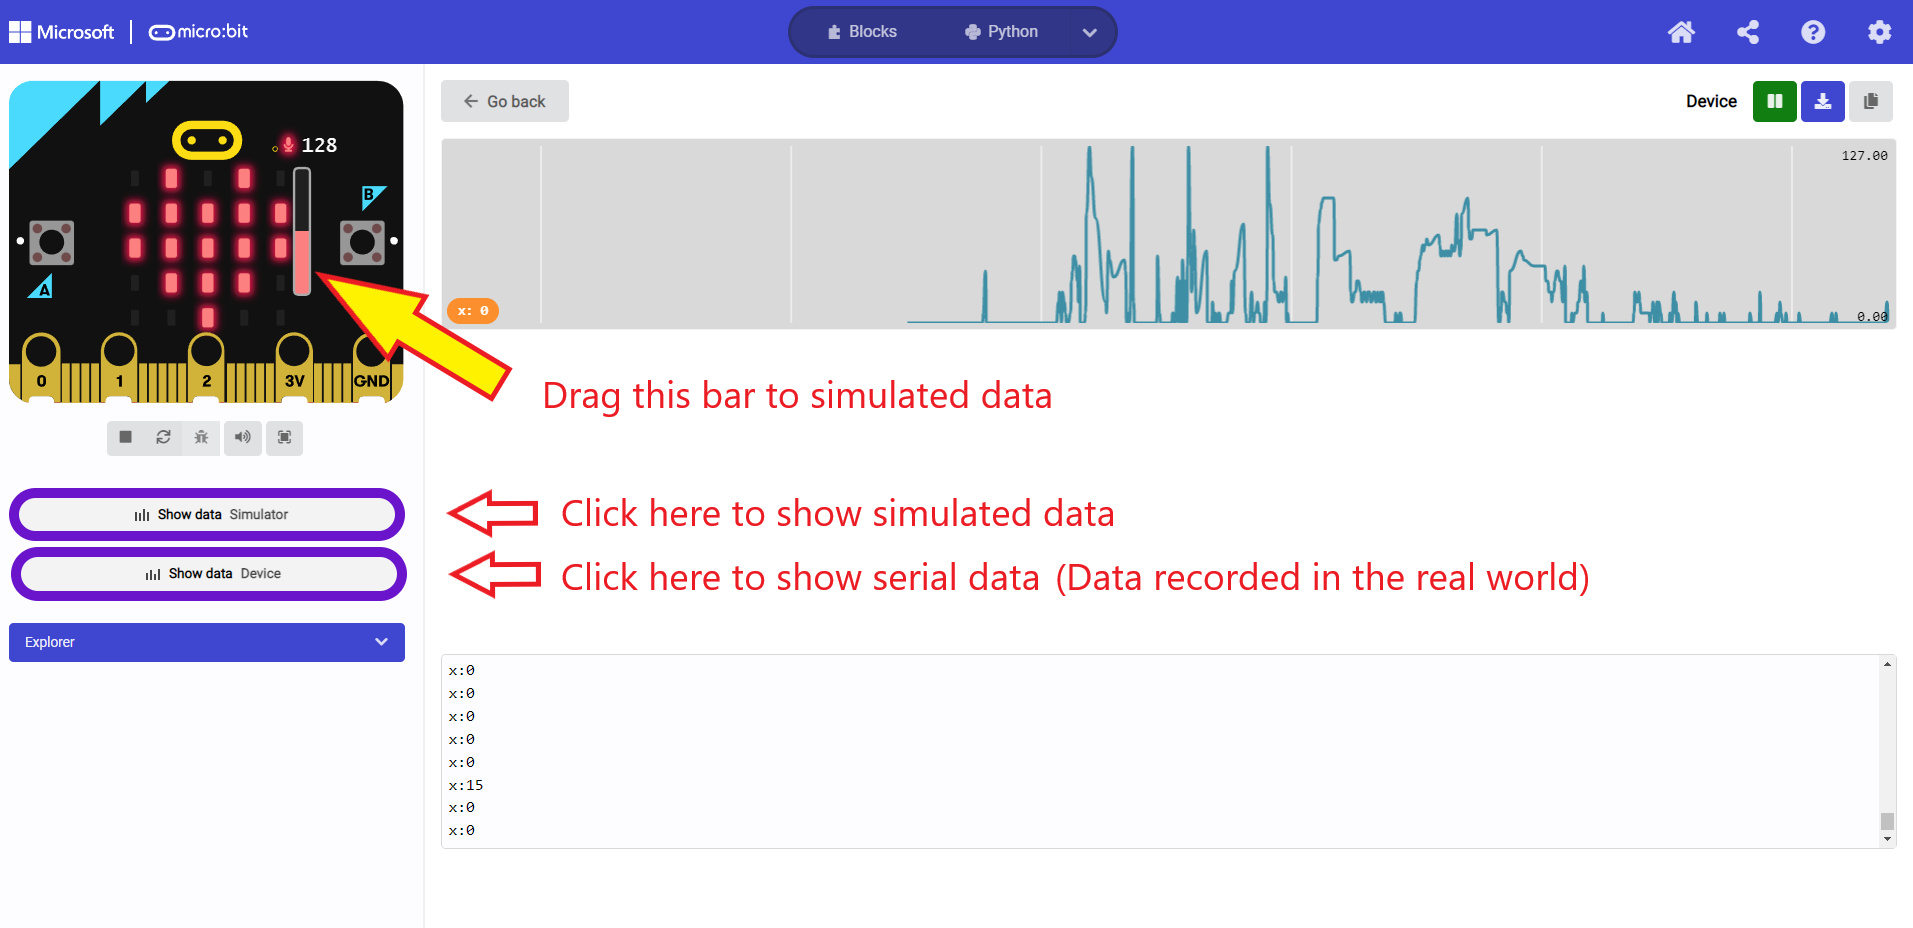
Important Questions
- What sound values do you see in the simulation? in real life?
- What is the maximum? What is the minimum?
👉🏾 Answer
- In the simulation you should see a minimum of 0, and a maximum of 255
- In real life, the values seem to range from 0 to 131!
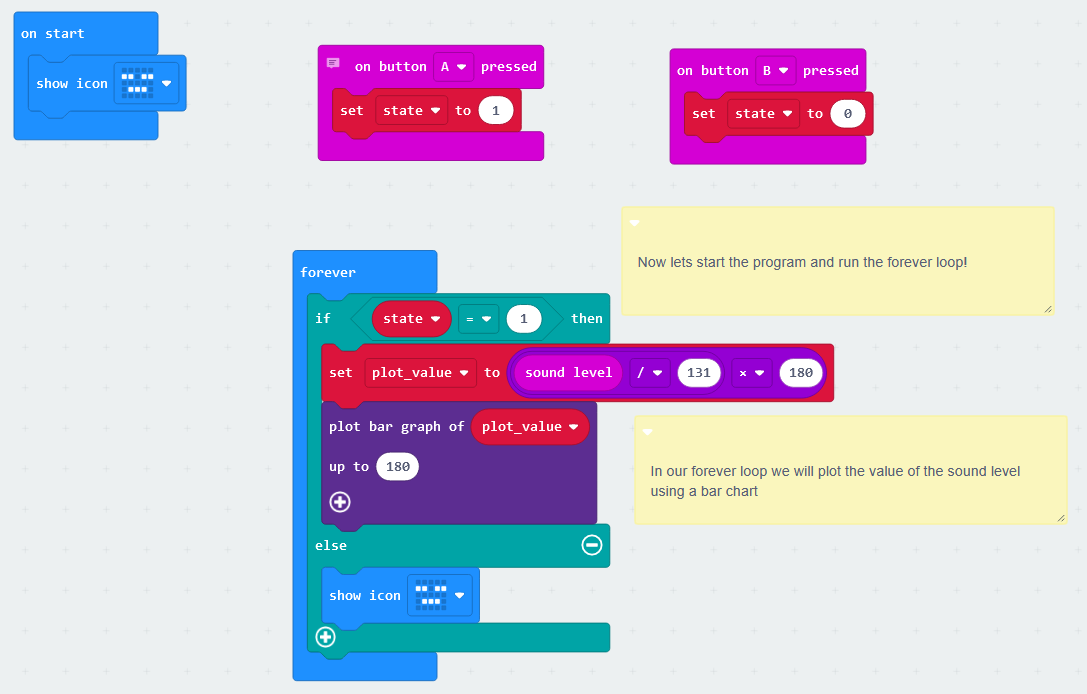
Now lets visualise the sound measurement on the micro:bit
- Write the program below
- This program allows us to plot a graph on the micro:bit leds to show how loud the sound is!
- If you’re interested, the documentation for the bar graph is here
- Check it is working correctly, you can check how it works in the simulator
| Blocks | Python |
|---|---|
|

|